Statistical Discrimination
Let’s assume Rivermoor College offers 100 open spots for next year.

Let’s also assume that 100 women apply …

… as well as 100 men.

The women and men are equally well qualified. There are also no differences concerning race, sexual orientation or some other common discrimination factors.
At the end of the application process the result is that 60 out of 100 men (i.e. 60%) were accepted to this college but only 40 out of 100 women (40%). Can we conclude that sex-based discrimination took place?

No matter if your answer is Yes or No, please spend a few minutes thinking about WHY you could be right or wrong before you continue reading. How sure are you? Imagine reading the headline: Study finds “Rivermoor College” accepts 40% of women and 60% of men. Would you feel outrage? Would you be convinced from the beginning that this can’t be true?
Whitespace to encourage you to think…
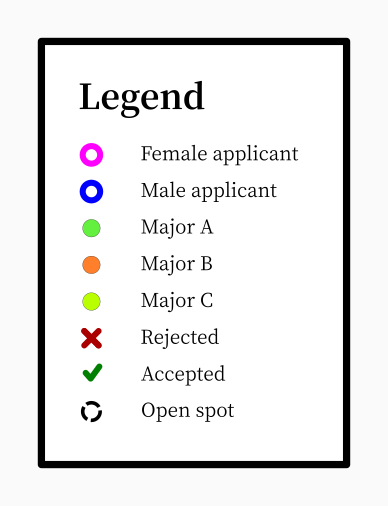
Below is a legend for how to read all the diagrams in this post.
Let’s look more closely what majors this college offers. Namely three different majors that we’ll call A, B and C. The number of spots they offer for different majors differs, however. 70 spots for major A, 20 spots for major B and 10 spots for major C.

Now let’s look at how many women and how many men apply to each major.
Major A (with 70 open spots) gets 20 applications by women and 80 applications by men.

Major B (with 20 open spots) gets 20 applications by women and 10 applications by men.

Major C (with 10 open spots) gets 60 applications by women and 10 applications by men.

As we can see, men and women differ in their preferences.
How are the acceptance rates within the majors?
For major A, 15 out of 20 women get accepted (75%) and 55 out of 80 men (69%).

Therefore, there is in fact discrimination against the men (because they are less likely to get into the major they applied for, even though there is no meaningful distinction between them and the women applying).
The same is true for major B. 16 out of 20 women (80%) and 4 out of 10 men (40%) get accepted.

And for major C. 9 out of 60 women (15%) and 1 out of 10 men (10%) get accepted.

Below are all the numbers summarized in a table.
| Major | Open Spots | Women | Men | ||||
|---|---|---|---|---|---|---|---|
| Applicants | Accepted | % Accepted | Applicants | Accepted | % Accepted | ||
| A | 70 | 20 | 15 | 75% | 80 | 55 | 69% |
| B | 20 | 20 | 16 | 80% | 10 | 4 | 40% |
| C | 10 | 50 | 9 | 15% | 10 | 1 | 10% |
| Total | 100 | 100 | 40 | 40% | 100 | 60 | 60% |
For any woman it is more likely she will get into the major she wants than for an equally qualified man and yet overall it looks like women are being discriminated against. The reason being that the women show a preference for the majors with fewer spots (i.e. the ones where it’s harder to get into). The real discriminatory trend against men reverses when combining the groups giving the impression of discrimination against women.
This phenomenon is called Simpson’s paradox.
Simpson’s paradox is a phenomenon in probability and statistics in which a trend appears in several groups of data but disappears or reverses when the groups are combined. This result is often encountered in social-science and medical-science statistics, and is particularly problematic when frequency data are unduly given causal interpretations.
Note: The point of this post is not to claim that everything that looks like discrimination is in fact a statistical effect or is in fact reverse discrimination. The reason for choosing a hypothetical example with sexual discrimination is to make you, the reader, more likely to remember Simpson’s paradox. I suspect that we as humans remember things that cause strong emotions better, in particular if they look like injustice. The data I use is completely made up. Rivermoor College does not exist as far as I know and should such a college exist that is a mere coincidence. I acknowledge that for simplicity this post assumed two genders but this is not meant to discriminate against anyone who does not identify with said genders.
Note: Were you immediately convinced that the Rivermoor College headline could only be a lie and are you feeling smug right now? How could a single headline give you enough information to come to such a strong conclusion? Did you in fact have multiple hypotheses in mind, one of which should have been “real discrimination against women is taking place”?
Diagrams created with Inkscape. Source file.